
TFT LCD Image Retention vs Burn-In: Causes and Prevention
The old menu is gone from the software, but it is still faintly sitting on the LCD. It may show up as a pale keyboard outline, a checkerboard trace, a logo shadow, or a fixed alarm bar that refuses to disappear on a gray screen. That is the moment a normal TFT LCD module review becomes an image retention investigation.
“The HMI stayed on the same status screen for a long time. After switching to a gray screen, the previous pattern is still visible. Is this TFT LCD burn-in, LCD image sticking, signal ghosting, or a panel-quality problem?”
The answer depends on the test condition. A residual image that fades in seconds is not the same problem as one that remains after several minutes. A mark that appears only after a high-contrast static UI is different from a line defect caused by timing, FPC bonding, or mechanical pressure. That is why TFT LCD image retention, LCD image sticking, ghosting, and burn-in-like complaints should be analyzed with the display pattern, temperature, gray level, recovery time, and drive waveform together.
The useful path is the bench path: confirm what the defect looks like, run a checkerboard-to-gray test, then trace the mechanism back to ionic impurities, feed-through voltage, and internal DC offset. For any custom TFT LCD module, that is more useful than writing “no burn-in allowed” in the specification and hoping both sides mean the same thing.
Start With the Gray Screen
Image retention becomes easiest to see after a high-contrast static screen has been displayed for a period of time and then switched to uniform gray. On black or white screens, the trace may be hidden. On a mid-gray screen, the old pattern can appear as a local block, a line, a menu bar, a keyboard area, a logo, or part of a previous UI panel.
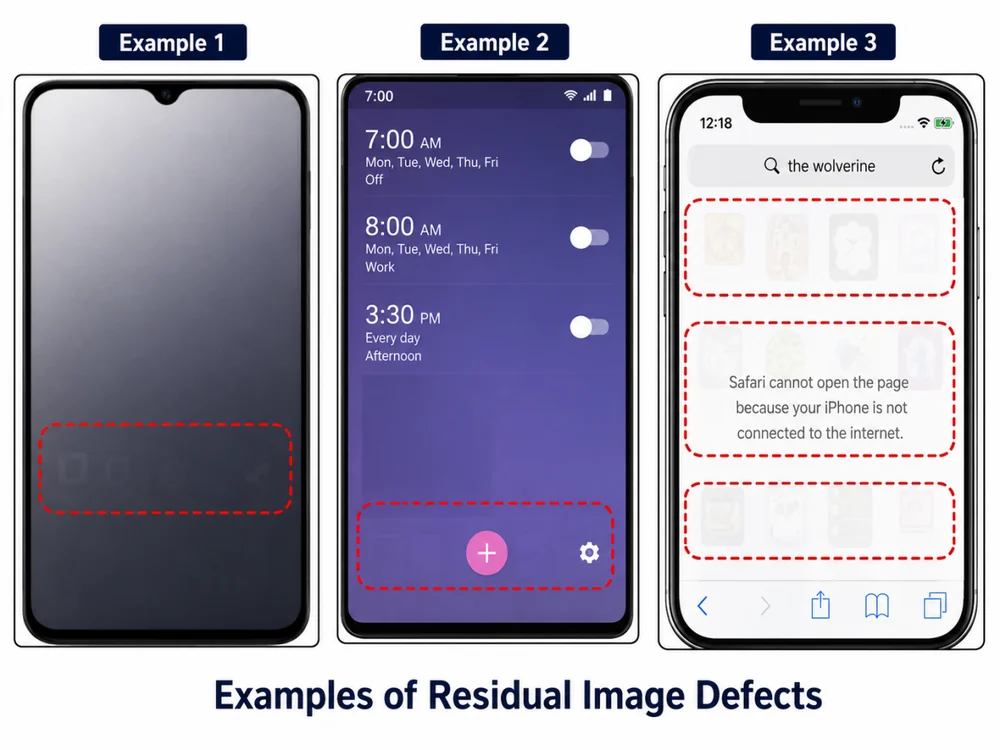
In real projects, the first question should not be “Is the LCD broken?” It should be “What was displayed, for how long, under what temperature, and how quickly did the residual image recover?” Those four details often separate temporary image sticking from a more serious panel or drive-balance issue.
If the symptom changes when RGB mapping, timing, or the interface is adjusted, review the TFT LCD interface guide before blaming the cell. If the same local image remains visible on a gray screen after a static pattern test, the analysis should move toward cell design, material purity, drive waveform, temperature, and product usage pattern.
Image Retention vs Burn-In
The word “burn-in” is common in customer complaints, but it can be misleading for TFT LCD. OLED burn-in is normally associated with irreversible pixel aging. TFT LCD image retention is usually related to residual electrical effects and liquid crystal behavior after long static drive conditions. It can often fade after dynamic content, a recovery pattern, or power-off time.
That does not mean every case is harmless. A display used in a 24/7 industrial HMI may show repeated status bars, warning icons, menu frames, or fixed numeric fields for thousands of hours. If the LCD cell, drive waveform, temperature, and UI design are not matched to this usage, temporary image retention can become a customer-visible reliability issue.
| Term used by customer | Typical technical meaning in TFT LCD | Engineering response |
|---|---|---|
| Burn-in | Often used loosely for any old image that remains visible. | Confirm whether the mark recovers. Do not assume OLED-style permanent aging. |
| Image retention | Residual image visible after long static display, often checked on gray screens. | Record static pattern, time, temperature, gray level, and recovery time. |
| Image sticking | A residual image caused by charge trapping, ionic movement, DC imbalance, or slow relaxation. | Review panel material, cell process, drive waveform, and usage pattern. |
| Ghosting | Sometimes used for image retention, sometimes for motion response or signal issues. | Check whether the defect is static-pattern related or motion/timing related. |
Checkerboard-to-Gray Test Method
The most common TFT LCD image retention test uses a black-and-white checkerboard pattern. The display is kept on this high-contrast static image for a defined time, then switched to a uniform gray screen. If the previous checkerboard remains visible, the engineer records the residual image level and the time needed for recovery.
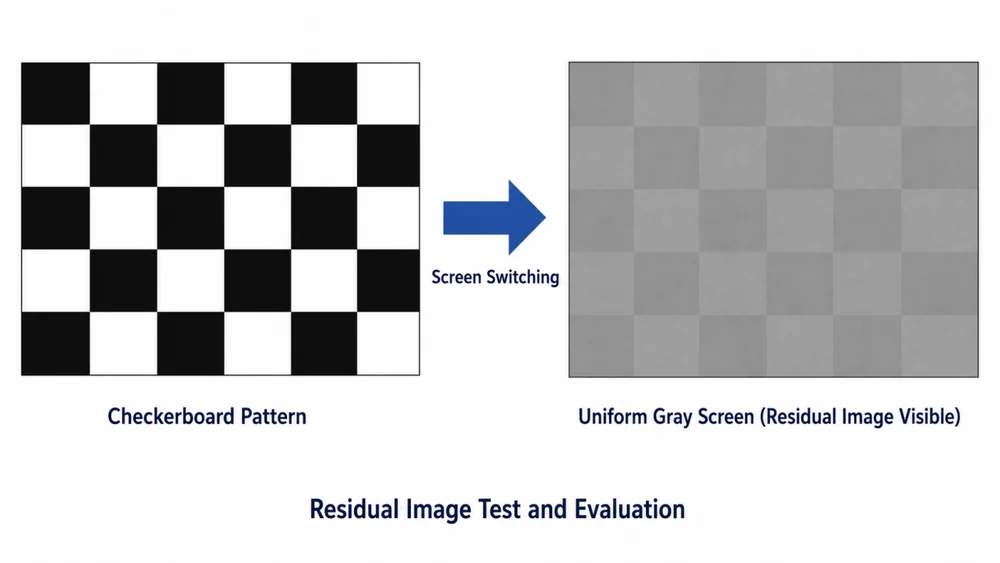
Why gray? A full black or full white screen can hide subtle optical differences. Mid-gray levels such as L32, L64, or L127 make small residual contrast easier to see. This is why customer specifications often define the checkerboard pattern, test duration, temperature, gray level, viewing condition, and acceptable recovery time.
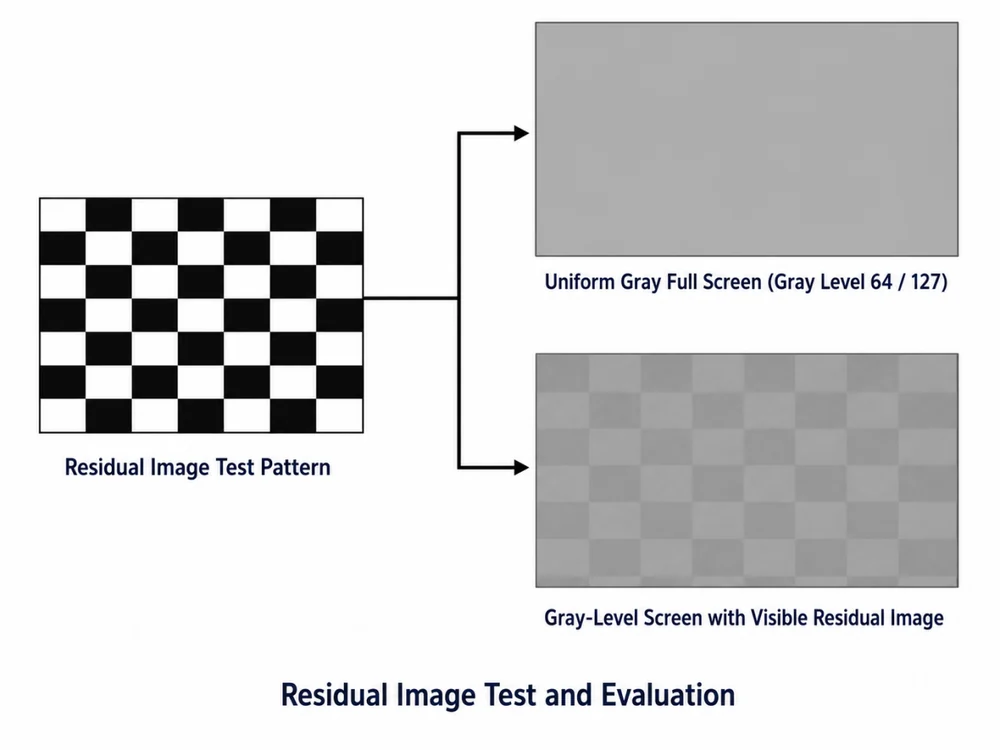
For a TFT LCD module used in industrial HMI projects, this test should be agreed early. The supplier and customer should not wait until mass production to discover that one side evaluates retention after one hour at room temperature while the other side expects a high-temperature test with a much shorter recovery window.
Typical TFT LCD Image Retention Test Conditions
In many customer specifications, the residual image test is written as a pattern-switching condition, not only as a visual complaint. A typical method is to display a black-and-white checkerboard pattern, where the black area is driven at gray level L0 and the white area at L255. The screen is then switched to a uniform gray image such as L32, L64, or L127, where residual contrast is easier to see.
The exact acceptance rule is not universal. Different customers may use different checkerboard sizes, display times, temperatures, gray levels, and recovery windows. The examples below show how much the requirement can change from one project to another.
| Example customer condition | Static test pattern | Stress condition | Gray-screen evaluation | Acceptance rule |
|---|---|---|---|---|
| Customer A | 6 x 8 black/white checkerboard | Room temperature, display on for 1 hour | Switch to L127, L64, and L32 gray screens | Check whether residual image is visible and record the disappearance time. |
| Customer B | 8 x 8 black/white checkerboard | Room temperature, display on for 1 hour | Switch to L127 gray screen | If residual image appears but disappears within 3 minutes, the result is judged OK. |
| Customer C | 6 x 8 black/white checkerboard | Room temperature, display on for 2 hours | Switch to L64 gray screen | If residual image appears but disappears within 5 seconds, the result is judged OK. |
| Customer D | 20 x 20 black/white checkerboard | 70 degrees C high temperature, display on for 3 minutes | Switch to L127 gray screen | If residual image appears but disappears within 5 minutes, the result is judged OK. |
These examples are not meant to replace the customer’s specification. They show why the test method must be written clearly in the RFQ, drawing, reliability plan, or acceptance standard. A display that passes one customer’s 3-minute recovery rule may fail another customer’s 5-second recovery rule, even if the symptom looks similar in a photo.
The conditions above illustrate how an acceptance specification can be written. They are not reported SuccessLCD sample-test results or universal pass limits. Record the source specification, revision and agreed method for the project being evaluated.
Test Variables That Change the Result
Image retention test results are sensitive. A small change in test method can create a different judgment, even on the same LCD module. This is one reason engineers should avoid vague statements such as “no residual image allowed” without a defined method.
| Variable | Why it matters | Typical project decision |
|---|---|---|
| Checkerboard size | Large and small blocks stress the eye and the pixel pattern differently. | Define the grid, such as 8 x 8 or 20 x 20, instead of only saying “checkerboard.” |
| Static display time | Longer static time gives ions and trapped charge more time to accumulate. | Use a time that matches the product risk, such as one hour, two hours, or a customer-defined stress test. |
| Temperature | High temperature changes ion mobility, LC behavior, and recovery speed. | Separate room-temperature judgment from high-temperature reliability screening. |
| Gray level after switching | Different gray levels reveal different residual contrast. | Specify L32, L64, L127, or another exact gray level. |
| Viewing and recovery time | A defect visible for ten seconds is different from one visible after several minutes. | Define inspection distance, angle, ambient light, and acceptable recovery time. |
When reviewing a failed sample, ask for a video rather than only one photo. A photo shows the existence of the residual image; a video shows how quickly it fades. That recovery curve is often more useful than a single pass/fail label.
Short-Term, Long-Term, Area, and Line Retention
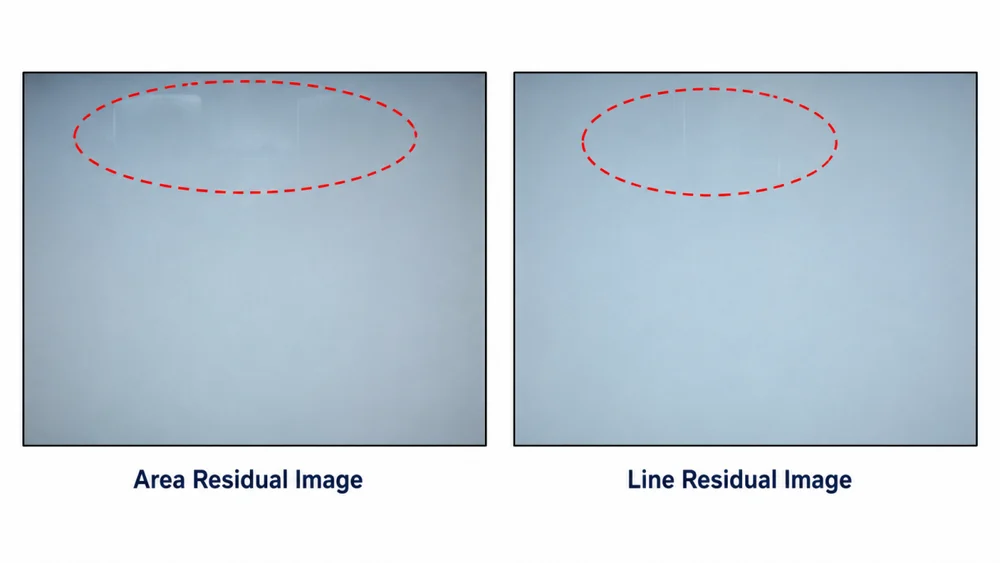
Image retention is not one single defect mode. In production and field analysis, it is useful to classify the symptom before deciding whether the issue belongs to the LCD cell, the module process, the drive signal, or the user interface design.
Short-term image retention
Short-term retention appears after a static image is shown for a relatively short time and normally fades quickly after the screen changes. If it recovers within the agreed specification, it may be acceptable for many applications. The important point is to verify the actual recovery time, not only whether a faint image can be seen for a moment.
Long-term image retention
Long-term retention appears after extended static display. The recovery time is longer, and in severe cases the trace may not disappear within the customer test window. This is the condition that deserves more attention in 24/7 equipment, especially when the UI contains fixed navigation bars, warning icons, camera overlays, or status blocks.
Area retention and line retention
Area retention usually follows a broad UI region or checkerboard block. Line retention may appear along a row, column, border, or repeated graphic edge. Line-type symptoms should be checked carefully against source driver behavior, gate/source loading, FPC bonding area, and static UI geometry. If the complaint also involves abnormal color patches, compare it with the TFT LCD red/blue mura case study, because pressure-related mura and image retention can be confused in early customer reports.
Why Ions and DC Offset Create Residual Images
A TFT LCD panel is designed to drive liquid crystal molecules with alternating polarity so that the long-term DC component is minimized. In a perfect cell, the positive and negative drive effects would be balanced. Real products are not perfect. LC material, PI alignment layers, sealant, overcoat material, ITO interfaces, and process residues can introduce trace ionic impurities. The drive waveform can also create small asymmetry.
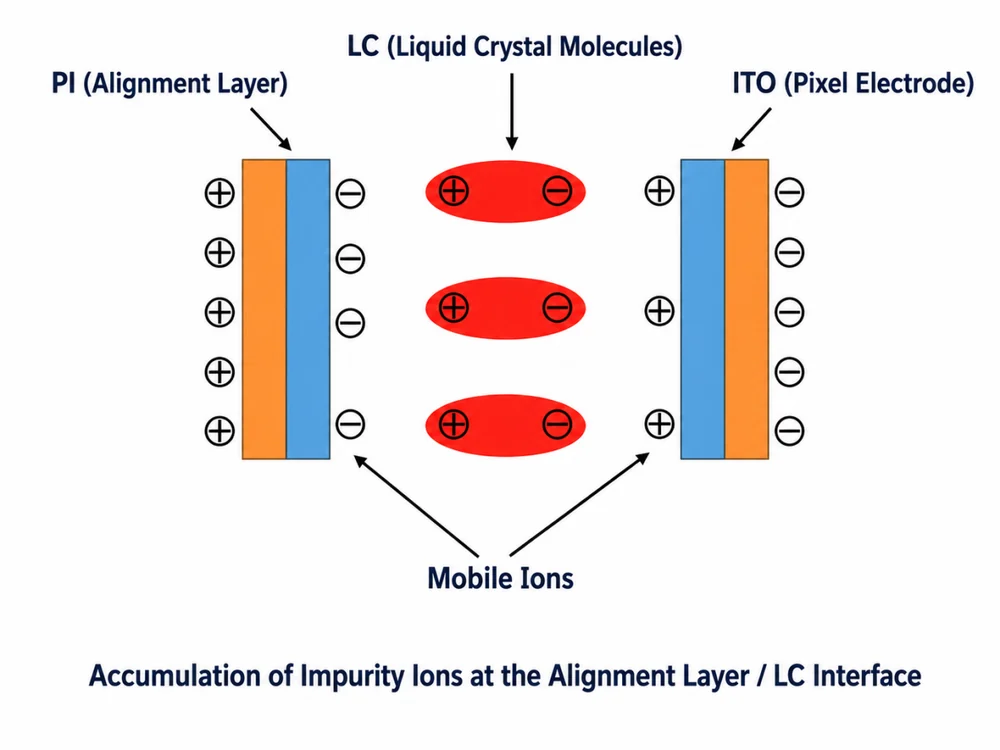
When a static high-contrast image is displayed for a long time, some pixels are held in one electrical condition while neighboring pixels are held in another. Mobile ions tend to drift and accumulate near interfaces. After the image changes, those ions do not instantly return to a uniform distribution. The result is a residual internal field, which changes the effective voltage seen by the liquid crystal molecules.
This is one reason material selection and cleanliness matter. The problem is not only a display usage issue. It can involve TFT LCD array materials, cell process control, alignment-layer quality, sealant compatibility, and the electrical balance of the display drive.
Feed-through voltage and parasitic capacitance
In an active-matrix TFT pixel, the gate line, source line, storage capacitor, pixel electrode, and common electrode do not exist in isolation. Parasitic capacitance between the gate and pixel node can produce feed-through voltage when the gate switches from on to off. If this feed-through effect is not well compensated, the positive and negative frame voltages may not stay perfectly symmetric around the desired common voltage.
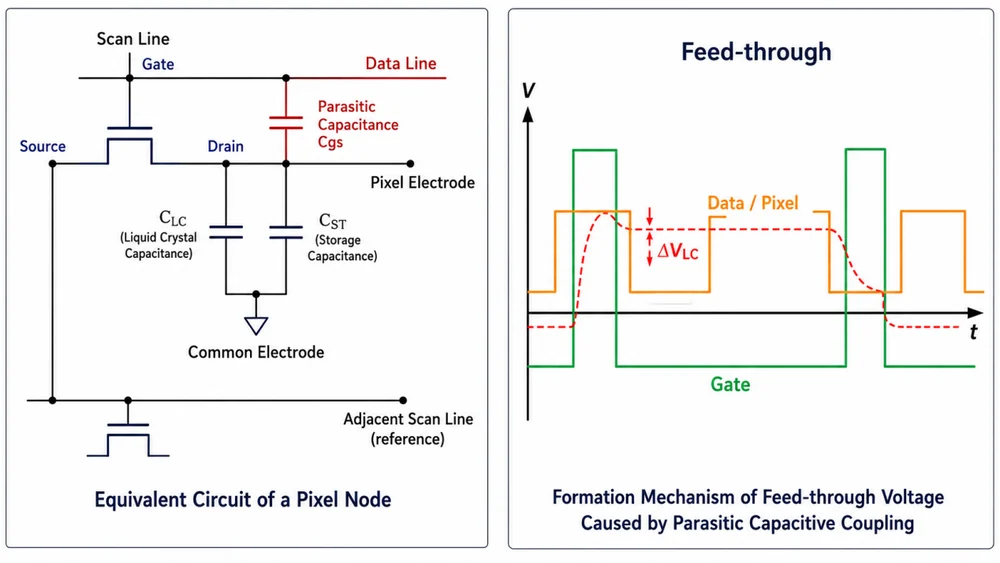
Small DC bias is especially important in image retention analysis. Even a weak residual DC component can attract ions over time. Once charge is accumulated at the interface, different regions of the display may show slightly different optical states after the image changes.
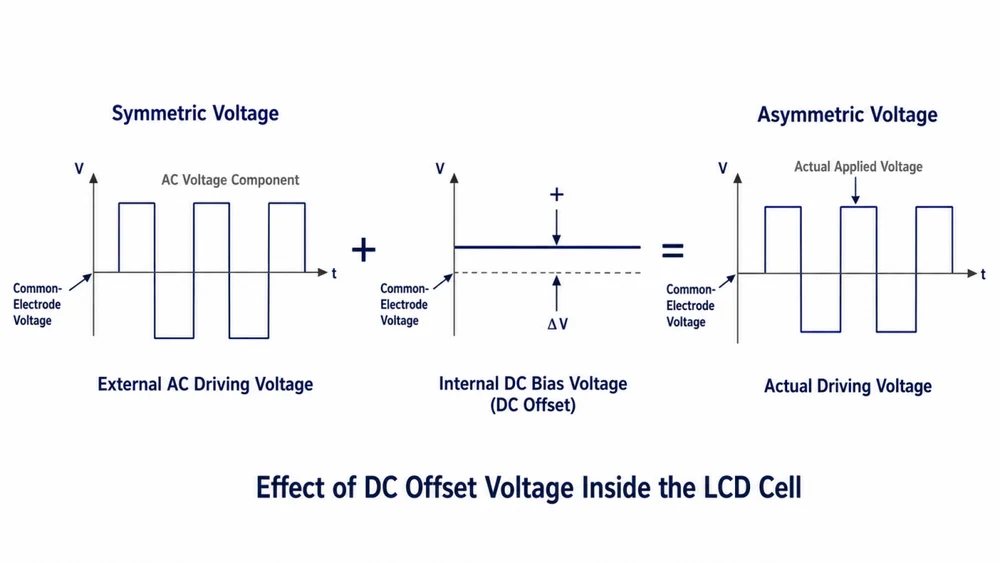
In simple terms, image retention is often a memory effect created by electrical stress and slow recovery inside the LCD cell. The previous image does not remain because the LCD is “burned.” It remains because some regions still behave as if part of the old electric-field history is present.
Engineering Checks Before Changing Hardware
Before replacing the LCD module or redesigning the panel, run a disciplined check. Many image-retention complaints become clearer after the team separates usage pattern, signal behavior, optical stack, and mechanical stress.
| Check item | What to confirm | Why it helps |
|---|---|---|
| Static UI content | Menu bars, fixed logos, alarm icons, chart grids, camera overlays, and white-on-black areas. | High-contrast static regions are the most common field trigger. |
| Operating temperature | Ambient temperature, backlight heat, enclosure temperature, and local hot spots. | Thermal stress changes recovery and can increase the visibility of weak defects. |
| Drive and timing | Vcom setting, polarity inversion mode, source/gate timing, and interface stability. | DC imbalance or waveform errors can make image sticking worse. |
| Module assembly | Bezel pressure, tape position, foam compression, touch panel lamination, and frame clearance. | Pressure mura can be mistaken for residual image if only photos are reviewed. |
| Backlight and optical stack | Brightness setting, diffuser/prism condition, thermal path, and optical bonding structure. | High brightness and heat should be reviewed together in long-life HMI design. |
For products exposed to outdoor or vehicle conditions, image retention should also be reviewed with high-brightness TFT LCD module design, wide-temperature TFT LCD module requirements, and the thermal effect of optical bonding versus air-gap LCD construction.
Prevention: Design the UI and Specification Together
Image retention prevention is not only the LCD supplier’s job and not only the software team’s job. The best result comes when the UI, drive, panel selection, thermal design, and acceptance test are aligned early.
- Avoid fixed high-contrast graphics staying in the same position for long periods.
- Use screen savers, low-contrast idle pages, dimming, or periodic UI movement when the product allows it.
- Define Vcom and polarity settings during validation, not after a field complaint.
- Control local heat from high-brightness backlights and closed enclosures.
- Specify checkerboard pattern, static display time, temperature, gray level, recovery time, and judgment method in the project documents.
The TFT LCD module manufacturing process also matters here. A clean cell process, stable bonding process, controlled module pressure, and correct handling reduce the risk of turning a marginal electrical effect into a visible customer complaint.
What to Include in the RFQ or Failure Report
If image retention risk is important in your project, do not describe it only as “anti burn-in required.” That phrase is too vague. A useful TFT LCD module RFQ should include the actual display content and test expectations.
- Product application, operating hours, and whether the display runs 24/7.
- Static UI examples, including menu bars, logos, alarms, camera frames, and fixed data areas.
- Backlight brightness, dimming mode, enclosure temperature, and ambient temperature range.
- Required image retention test pattern, test duration, temperature, gray level, viewing condition, and recovery criterion.
- Photos and videos showing the residual image before and after recovery.
- Interface type, timing, Vcom setting if available, and any firmware changes made before the symptom appeared.
For custom projects, this information helps the supplier recommend the right LCD cell, polarizer, backlight, bonding method, and drive settings instead of guessing from one photo. It also makes the acceptance standard clearer before tooling, qualification, and mass production.
FAQ
Is TFT LCD image retention the same as OLED burn-in?
No. TFT LCD image retention is usually related to residual charge, ion movement, DC imbalance, or liquid crystal relaxation. OLED burn-in is normally related to permanent pixel aging. Customers may use the same word, but the engineering causes are different.
Why is a checkerboard pattern used for LCD image retention testing?
A checkerboard pattern creates strong local contrast between black and white regions. After switching to a uniform gray screen, any residual pattern is easier to see and compare.
Can TFT LCD image retention recover?
Many cases can recover after dynamic content, a uniform recovery screen, or power-off time. The important specification is how long the residual image remains visible under the agreed test condition.
Does high brightness cause image retention?
Brightness alone is not the only cause, but high-brightness operation can raise module temperature. Temperature can affect ion mobility, LC behavior, and recovery, so high brightness and thermal design should be checked together.
What is the first thing to send for supplier analysis?
Send the static image, display time, temperature, gray-screen test result, recovery video, interface/timing information, and photos of the module installation. These details are more useful than a single complaint photo.
Need to Control Image Retention Risk in a Custom LCD Project?
Success Intelligence can review the display content, operating temperature, backlight brightness, interface, mechanical stack-up, and reliability test conditions before the module design is locked.


